[TRADE_PLUGIN]SHIBUSDT,SHIBUSDT[/TRADE_PLUGIN]
#SHIB
- Coiling Price Action: SHIB is trading in a tight range between key Bollinger Bands, indicating compression that typically precedes a volatile move.
- Bullish Divergence Hint: The positive MACD histogram suggests underlying buying pressure is building, despite the sideways price movement.
- Sentiment Awaits Breakout: Market news and forecasts are unanimously pointing to a pivotal moment, with a breakout above $0.0000063 seen as the trigger for a new bullish phase.
SHIB Price Prediction
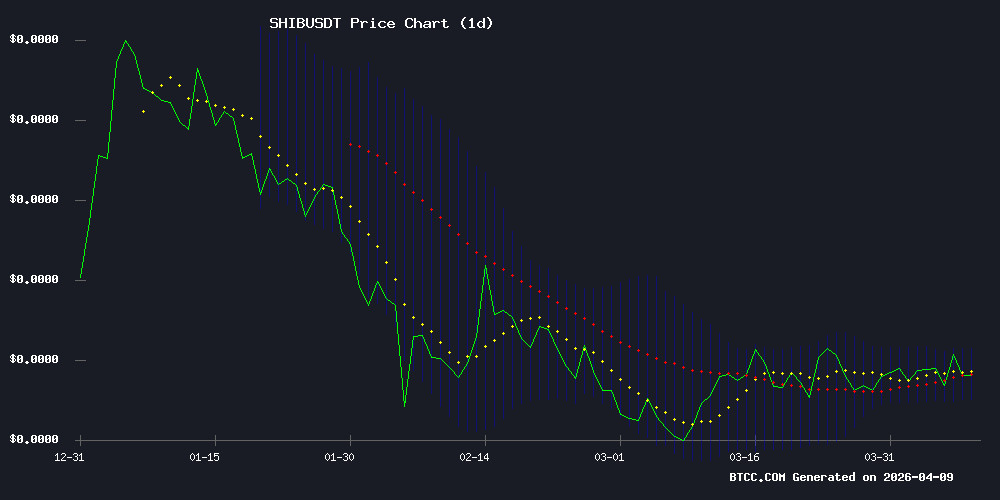
Technical Analysis: SHIB Shows Consolidation Signals
As of April 9, 2026, SHIB is trading at 0.00000589 USDT, slightly below its 20-day moving average of 0.00000594, indicating a neutral to slightly bearish short-term momentum. The MACD histogram shows a positive value of 0.00000006, suggesting a potential for upward momentum, though the signal line remains negative. Price action is currently within the Bollinger Bands, with the upper band at 0.00000620 and the lower at 0.00000569, pointing to a period of low volatility and consolidation. 'The price is coiling within a tight range, which often precedes a significant move,' says BTCC financial analyst Ava. 'A sustained break above the 20-day MA and the upper Bollinger Band could signal the start of a new uptrend.'
Market Sentiment: Awaiting a Catalyst
Current news headlines reflect a market in a holding pattern. Phrases like 'consolidates near key resistance,' 'struggles below $0.000006,' and 'sideways trend builds momentum' collectively paint a picture of cautious optimism trapped by low volatility. This sentiment aligns with the technical picture of consolidation. 'The market narrative is waiting for a spark,' observes BTCC financial analyst Ava. 'The bullish forecasts for a breakout toward $0.0000063 are contingent on overcoming the immediate resistance and seeing a surge in trading volume to break the current slowdown.' The overall sentiment is neutral, with a bullish bias contingent on a successful technical breakout.
Factors Influencing SHIB’s Price
Shiba Inu Consolidates Near Key Resistance Amid Low Volatility
Shiba Inu (SHIB) hovers near the $0.000006 resistance level, showing muted 1% gains in the past 24 hours. The meme coin’s trading range has tightened since October, with technical indicators suggesting a potential triangle pattern formation. Market momentum remains neutral, as reflected by RSI data, while volume stagnation underscores indecision among traders.
Critical levels to watch: $0.0000063 acts as immediate resistance, with support firming near $0.0000058. Historical April performance data from CryptoRank shows mixed results for SHIB, leaving the current consolidation phase open to breakout potential.
Shiba Inu (SHIB) Struggles Below $0.000006 Amid Market Slowdown
Shiba Inu (SHIB) continues to face downward pressure, trading at $0.000005813—a 3.01% decline over the past 24 hours. The meme coin remains 93% below its all-time high of $0.00008616, set nearly five years ago. Despite this, SHIB still reflects a staggering 600,000% gain from its historical low.
The broader crypto market contraction that began in 2022 erased $2.1 trillion in capitalization, with SHIB mirroring the sector's volatility. Current trading volume stands at $103.38 million, as investors weigh the token's speculative appeal against fading momentum.
SHIB Price Forecast: Sideways Trend Builds Momentum Toward $0.0000063 Breakout
Shiba Inu (SHIB) exhibits mixed momentum as of 7 April 2026, with short-term weakness offset by broader stability. The token declined 2.53% in 24 hours, reflecting transient selling pressure, yet weekly performance remains steady within its established range.
Currently trading at $0.000005877, SHIB sees fluctuating activity with $95.53 million in daily volume—a 14.07% dip. Market capitalization stands at $3.45 billion, down 2.94%.
Technical analysis reveals a consolidation pattern between $0.0000056 support and $0.0000063 resistance. Repeated rejections at $0.0000061-0.0000062 demonstrate seller dominance, while buyside interest emerges near $0.0000057-0.0000058. This equilibrium suggests accumulation before potential breakout.
How High Will SHIB Price Go?
Based on the current technical setup and market sentiment, SHIB's immediate trajectory hinges on its ability to break out of the current consolidation. The primary near-term target is the resistance zone around $0.00000620, coinciding with the upper Bollinger Band. A decisive close above this level, confirmed by rising volume, could open the path toward the next significant target of $0.0000063 as highlighted in market forecasts. In a bullish scenario, sustained momentum could then aim for higher resistance levels. However, failure to hold above the 20-day MA and the lower Bollinger Band at $0.00000569 could see a retest of support levels. Key technical levels are summarized below:
| Level | Price (USDT) | Significance |
|---|
| Current Price | 0.00000589 | Consolidation Zone |
| Immediate Resistance | 0.00000620 | Upper Bollinger Band |
| Primary Bull Target | 0.00000630 | News Forecast Breakout Level |
| Key Support | 0.00000569 | Lower Bollinger Band |
| 20-Day Moving Average | 0.00000594 | Short-Term Trend Gauge |
Ultimately, while the setup suggests building momentum for a push higher, the move requires a catalyst to break the current low-volatility environment, as noted by BTCC's Ava.


Log in to Reply
Log in to comment your thoughtsComments